Example: Northeast Pacific Transboundary Sablefish Model
nep_transboundary_sablefish.RmdHere we describe an implementation of the custom management strategy
evaluation model built for the transboundary Northeast Pacific sablefish
stock (Kapur 2023, Kapur et al. 2024) using the afscOM
framework. The original model is a spatially-explicit, multi-stock, age-
and sex-structured population model that spans the Northeast Pacific
Ocean, from the U.S. - Mexico border to the Bering Sea and Aleutian
Islands, and accounts for fishing by seven distinct fishing fleets
across six spatial regions spanning three management regimes. For a full
description of the original model, see Kapur et al. (2023) and Kapur et
al. (2024).
The transboundary sablefish model represents a useful case study for
the afscOM package as it includes multiple unique “stocks”
that share demographic rates, but can span across spatial units, as well
as multiple fisheries that are active in only a subset of the spatial
regions. As such, the original transboundary sablefish model is able to
produce complex population dynamics that make use of a wide variety of
the features implemented by afscOM.
The level of complexity of the original model implementation is not
fully reproducible by afscOM at current (July 2024). Major
discrepencies include the afscOM treatment of growth (via
weight-at-age), the original model’s use of sub-annual “seasonal”
timesteps and the associated timing of natural morality, fishing
mortality, movement, and recruitment processes, and the allocation of
catch across fleets and regions. It is also notable that the original
model utilized a different algorithm to solve for the fishing mortality
that would yield a specific annual catch (Pope’s approximation) than
what is implemented within afscOM (Baranov catch
equation).
Fleet and region names have been anonymized here.
Implementing the Transboundary Sablefish Model in
afscOM
The full implementation of the transboundary sablefish model is quite
similar to the process described in the “Spatial OM Example”, though
determination of the proper spatial and spatial-fleet catch
apportionment was complicated. For more details on specifying a generic
spatial OM using afscOM please see the “Spatial OM
Example”.
Comparison
Despite some simplifications with regards to the treatment of
seasonal event timing, growth, and small discrepancies in the exact
region-fleet catch apportionment, the afscOM implementation
was able to closely match the trend and scale of spawning biomass that
was produced from the original model (Figure 1). Discrepancies,
particularly in terms of scale, are believed to largely be the result of
providing summarised, end-of-year, weight-at-age data to the
afscOM model rather than using the more nuanced seasonal
growth that occurred in the original model.
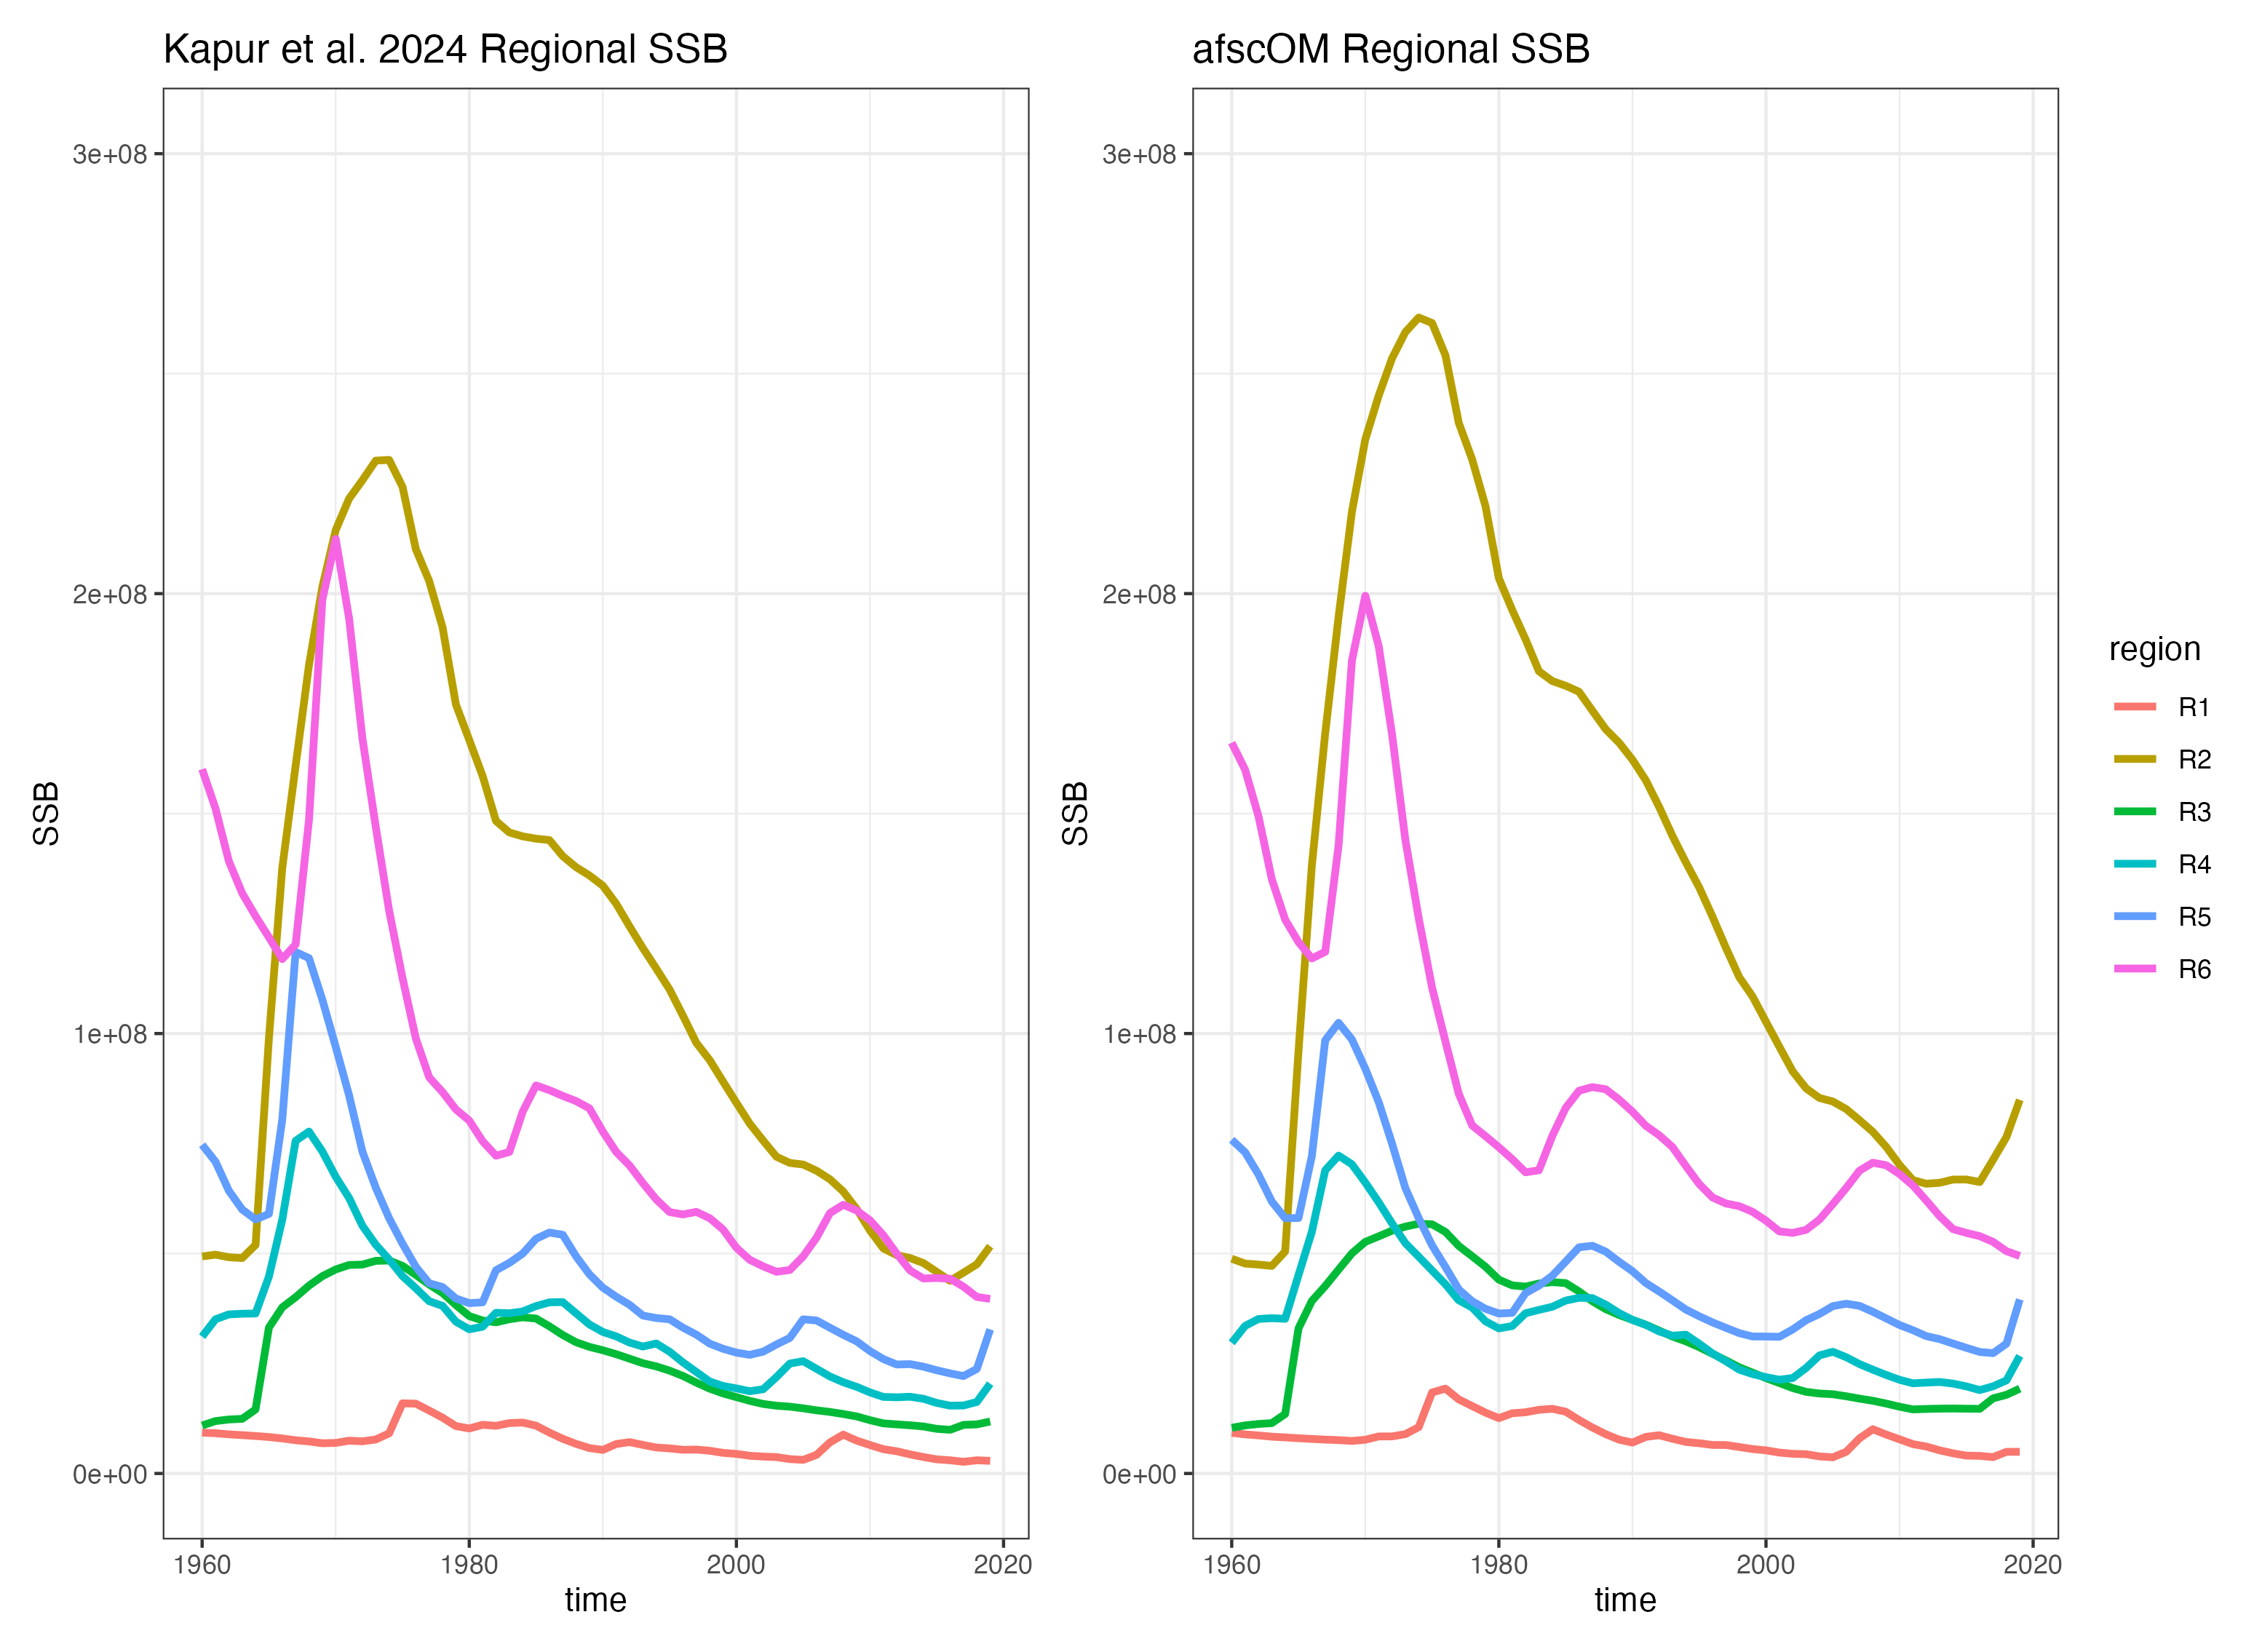 Figure 1: Side-by-side comparison of spawning biomass by spatial region
from the NEP transboundary sablefish model (left) and the
re-implementation using afscOM (right).
Figure 1: Side-by-side comparison of spawning biomass by spatial region
from the NEP transboundary sablefish model (left) and the
re-implementation using afscOM (right).
Regional fishing mortality was also similar across the two model implementations, despite use of different algorithms to solve for the correct fishing mortality given annual catch allocations (Figure 2). The source of the large discrepency in fishing mortality for Fleet 4 and Fleet 5 between the two models is currently unknown, but is the subject of active investigation and testing.
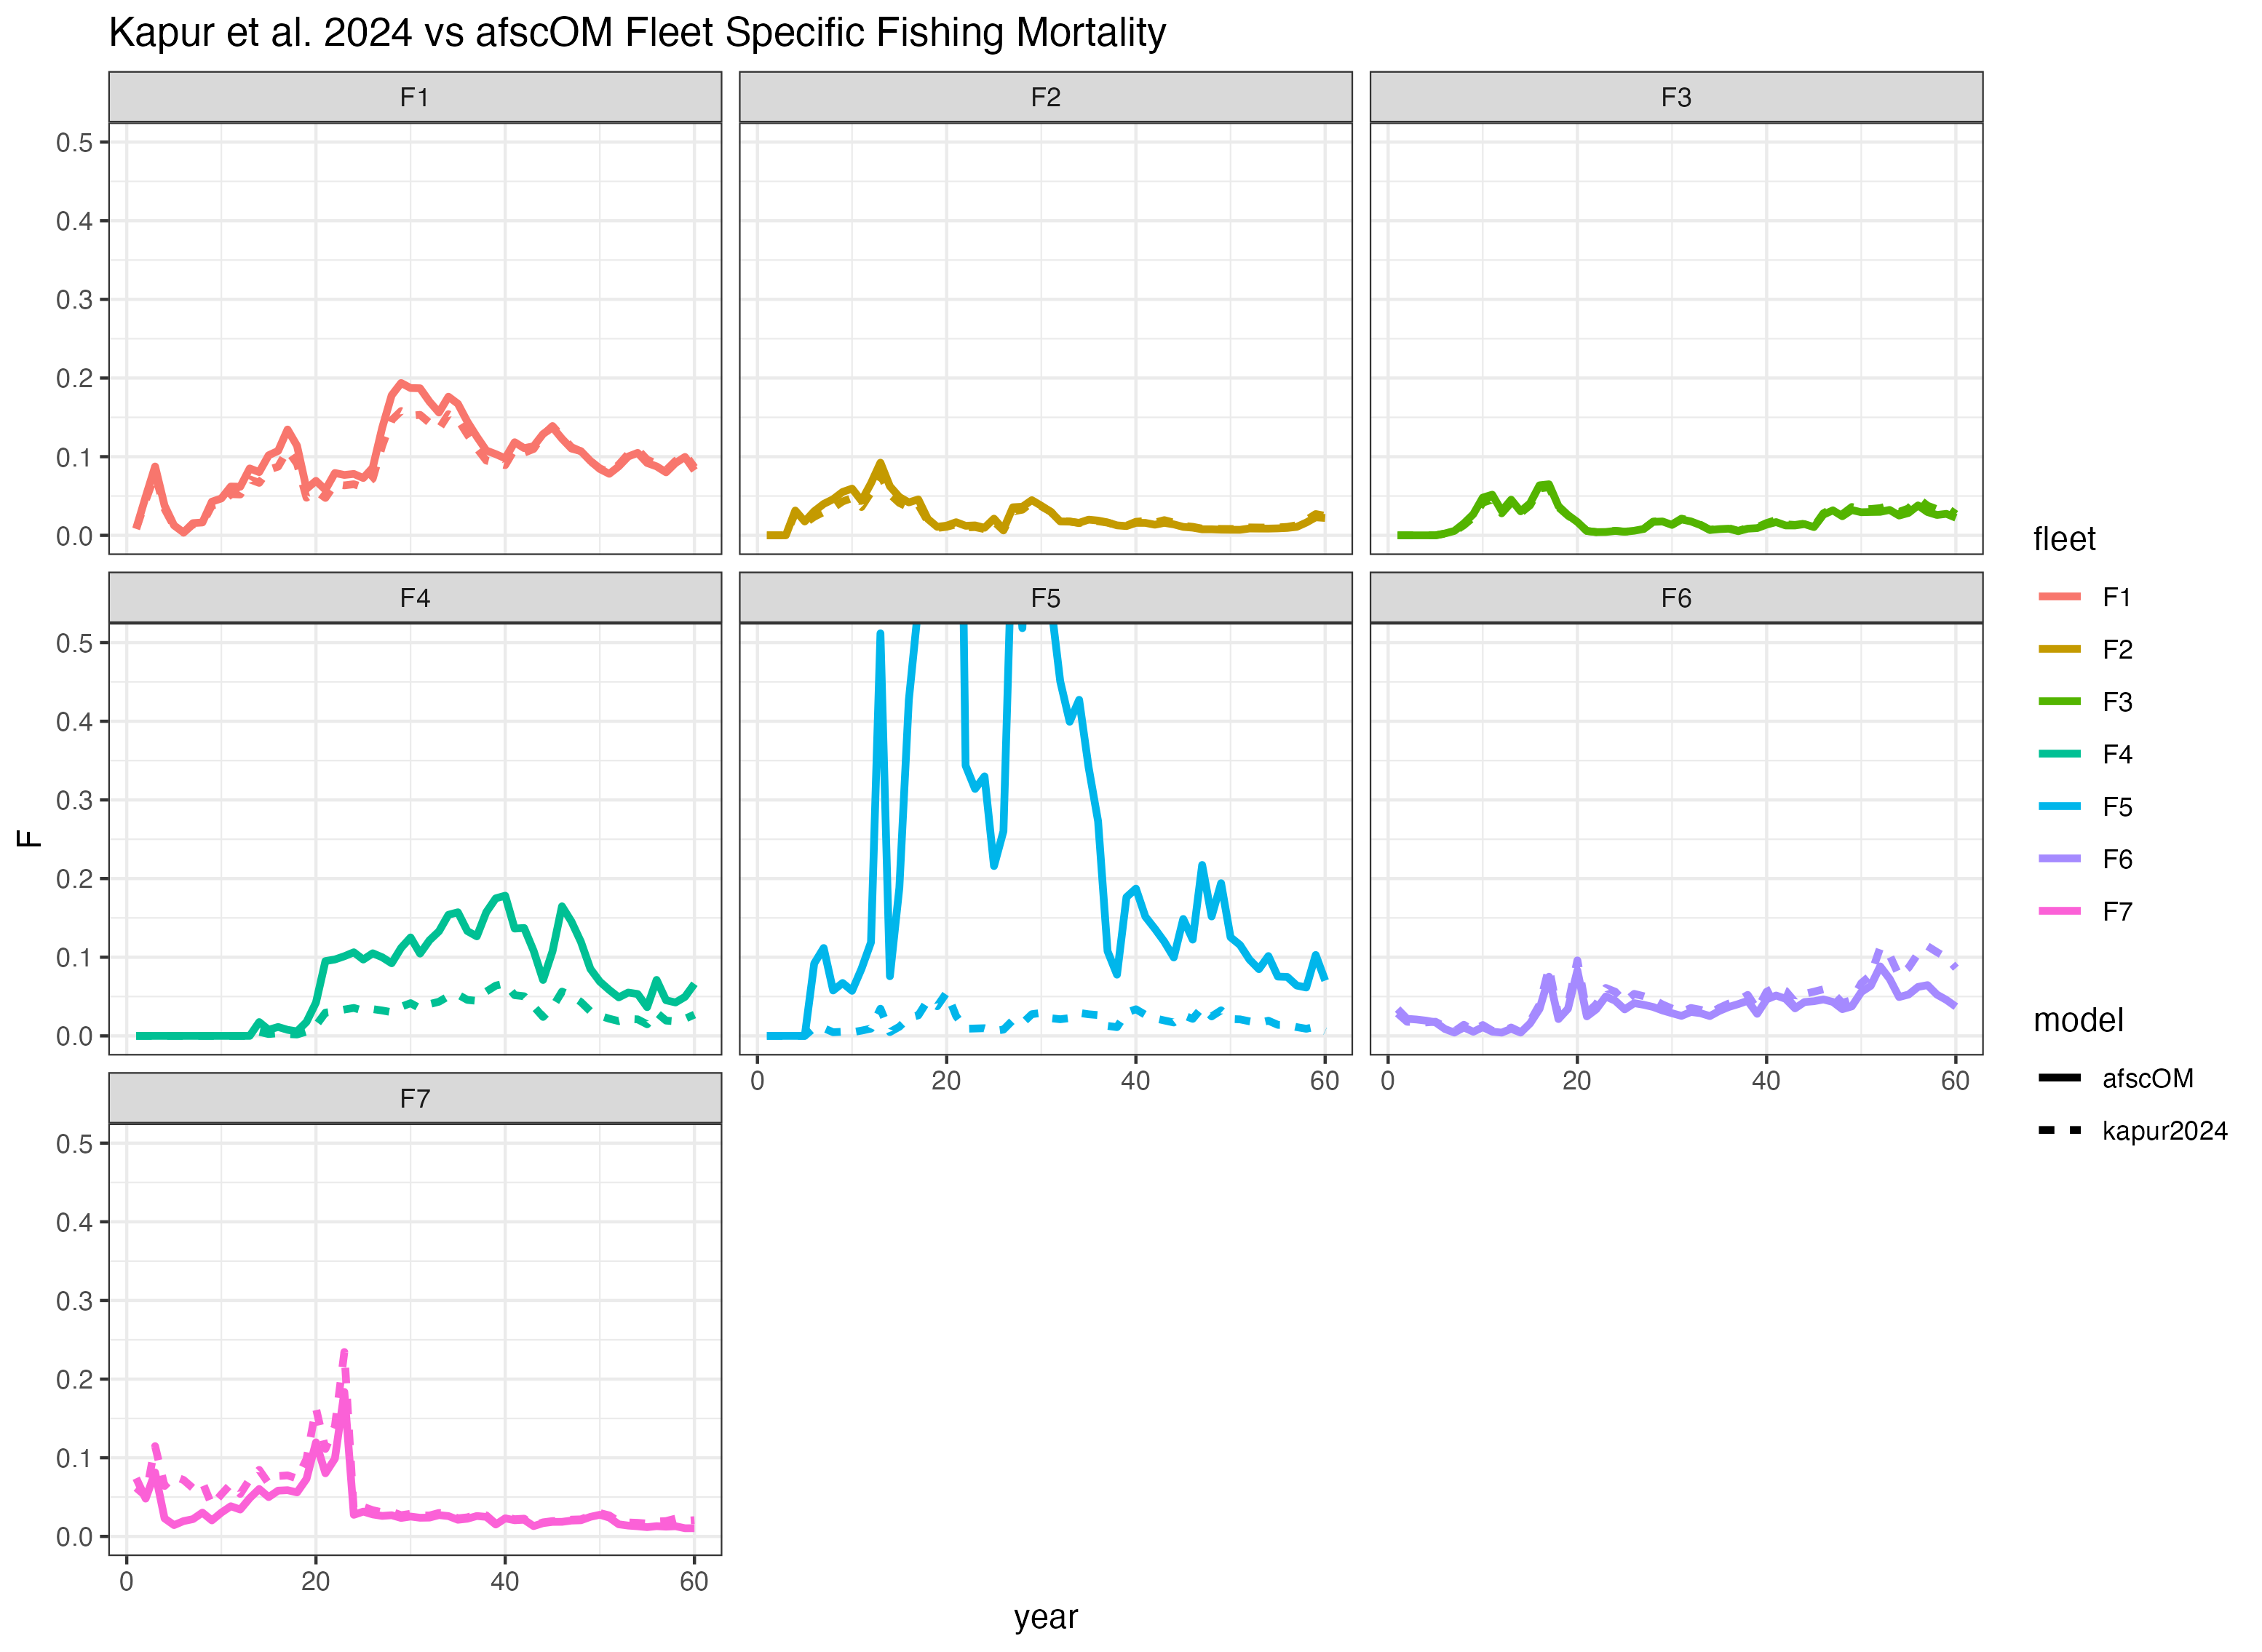 Figure 2: Comparison of fleet-specific fishing mortality between the NEP
transboundary sablefish model (dashed lines) and the afscOM
implementation (solid lines).
Figure 2: Comparison of fleet-specific fishing mortality between the NEP
transboundary sablefish model (dashed lines) and the afscOM
implementation (solid lines).
References
Kapur, M.S., Haltuch, M.A., Connors, B.M., Berger, A.M., Holt, K., Marshall, K.N., and Punt, A.E. 2024. Range-wide contrast in management outcomes for transboundary Northeast Pacific sablefish. Can. J. Fish. Aquat. Sci. NRC Research Press. doi:10.1139/cjfas-2024-0008.
Kapur, M.S. 2023. A Management Strategy Evaluation for Transboundary Sablefish in the Northeast Pacific Ocean. Dissertation, University of Washington, Seattle, WA.